

IMPACT & REACH
Every number on this page represents a young person whose opportunities have expanded through education. We measure our success not only by exam results, but by the lives our students build after leaving LREC.
RESULTS THAT OPEN DOORS
🎓 51 alumni pursuing bachelor’s degrees
📚 66 alumni currently studying
🌍 Graduates studying or working in Liberia, Rwanda, Ghana, India, China, Türkiye and the UAE
💼 Alumni building careers in education, health sciences, IT, accounting, engineering, and other professional fields, while many others have established their own businesses and entrepreneurial ventures
🚀 Our graduates have gone on to make an impact with organisations including Catholic Relief Services, Unisea, Orion Reederei, The Inquirer newspaper, the Liberia Petroleum Refining Company (LPRC), and many other employers across Liberia and beyond
“Beyond academics, LREC provided an environment where I felt encouraged, supported, and confident. I was given the opportunity to learn, grow, and explore my potential. The support from teachers and administrative staff helped me grow not only as a student, but also as a person.”

2025-26 AT A GLANCE
| Students | 348 |
| Alumni | 178 |
| Staff | 38 |
| Average class size | 23 |
| Students per teacher | 15 |
| Years of operation | 18 |
| AMONG GRADUATES WHOSE POST-SCHOOL PATHWAYS ARE KNOWN (60%) | |
| Enrolled in university | 71% |
| Enrolled in vocational or technical training | 13% |
| Achieved a bachelor's (4 year) degree | 16% |
| Achieved an associate (2 year) degree | 7% |
| Achieved a trade certificate or diploma | 10% |
| WEST AFRICA EXAMINATION RESULTS | |
| Students passing any 9+ WASSCE subjects | 96% |
| Students passing any 8+ WASSCE subjects | 100% |
| Students obtaining A1-C6 (credit or higher) in 5+ WASSCE subjects | 100% |
| Students obtaining A1-B3 in 3+ WASSCE subjects | 100% |
| Students obtaining A1-B3 in 4+ WASSCE subjects | 71% |
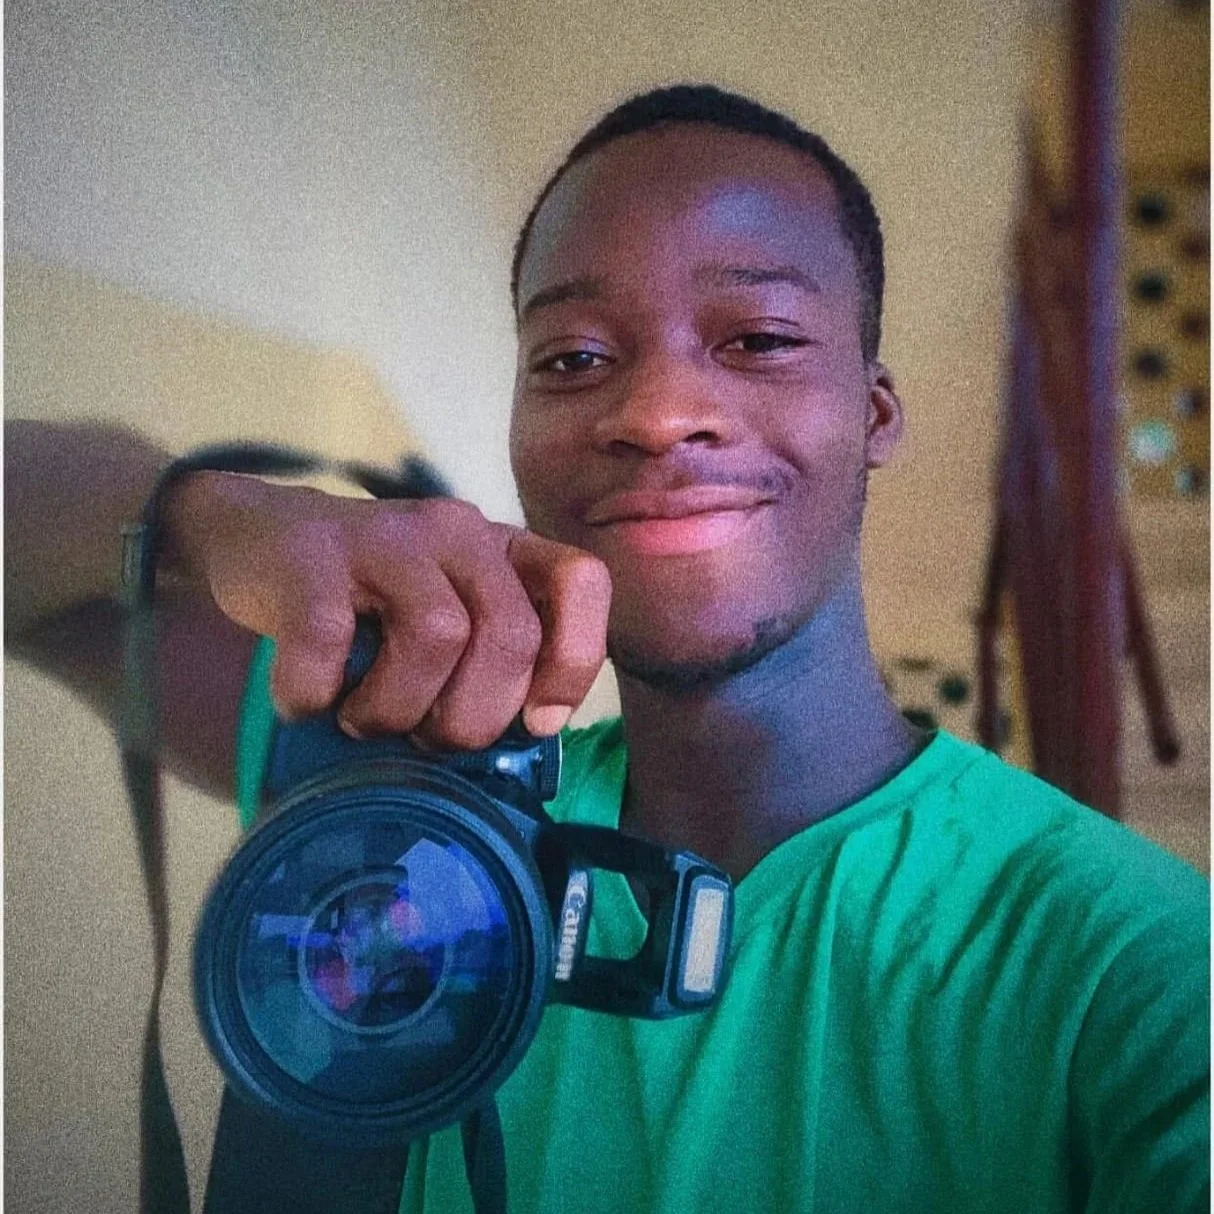
“LREC didn’t just give me academics; it gave me hope. I learned vocational skills—electricity, bricklaying, computer basics—skills I never thought I could master. ”
WHAT OUR GRADUATES CHOOSE TO STUDY
ANNUAL REPORTS
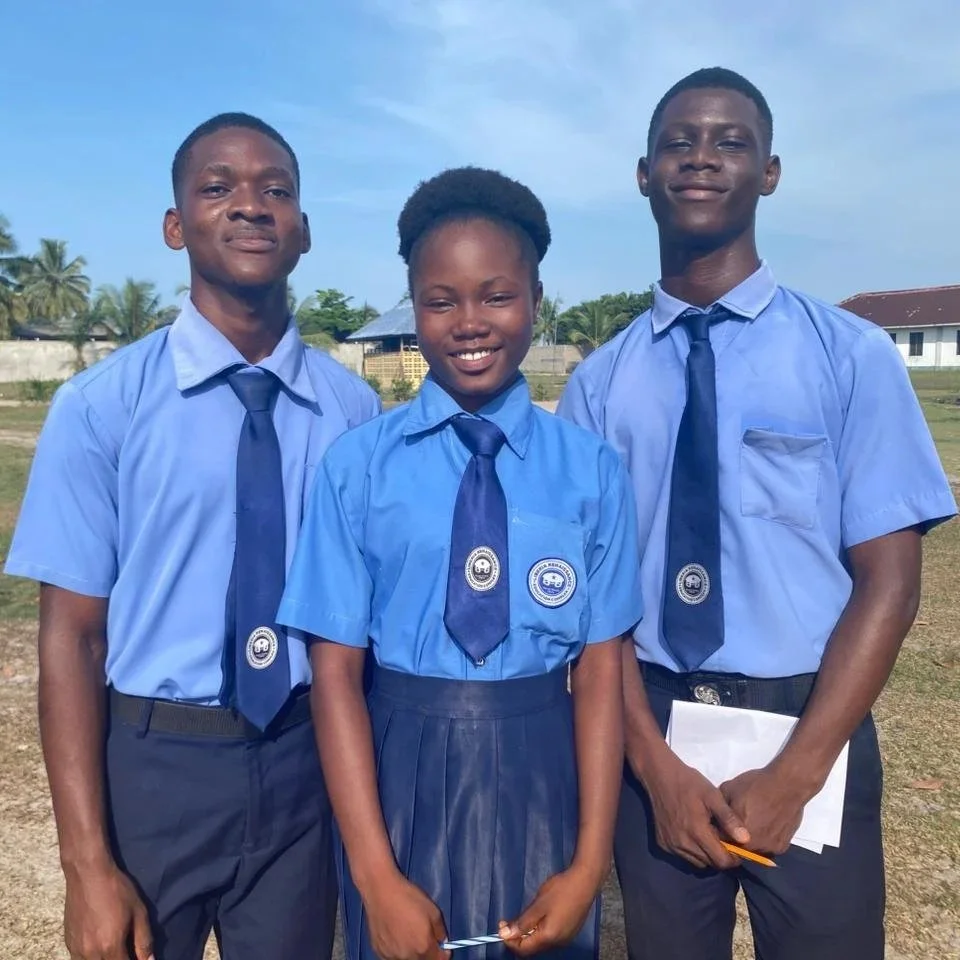
ANNUAL UPDATE 2024-25

ANNUAL UPDATE 2023-24
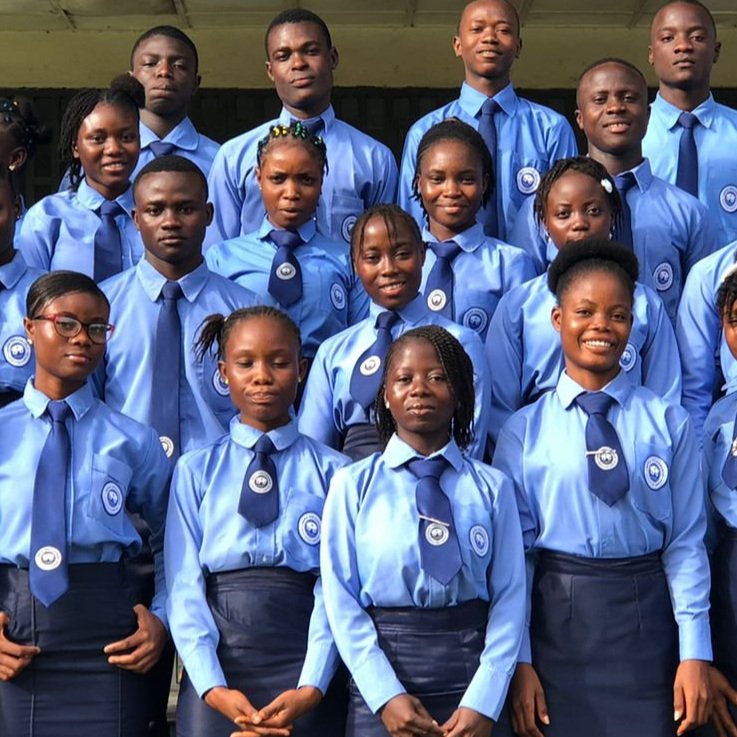
ANNUAL UPDATE 2022-23

ANNUAL UPDATE
2021-22
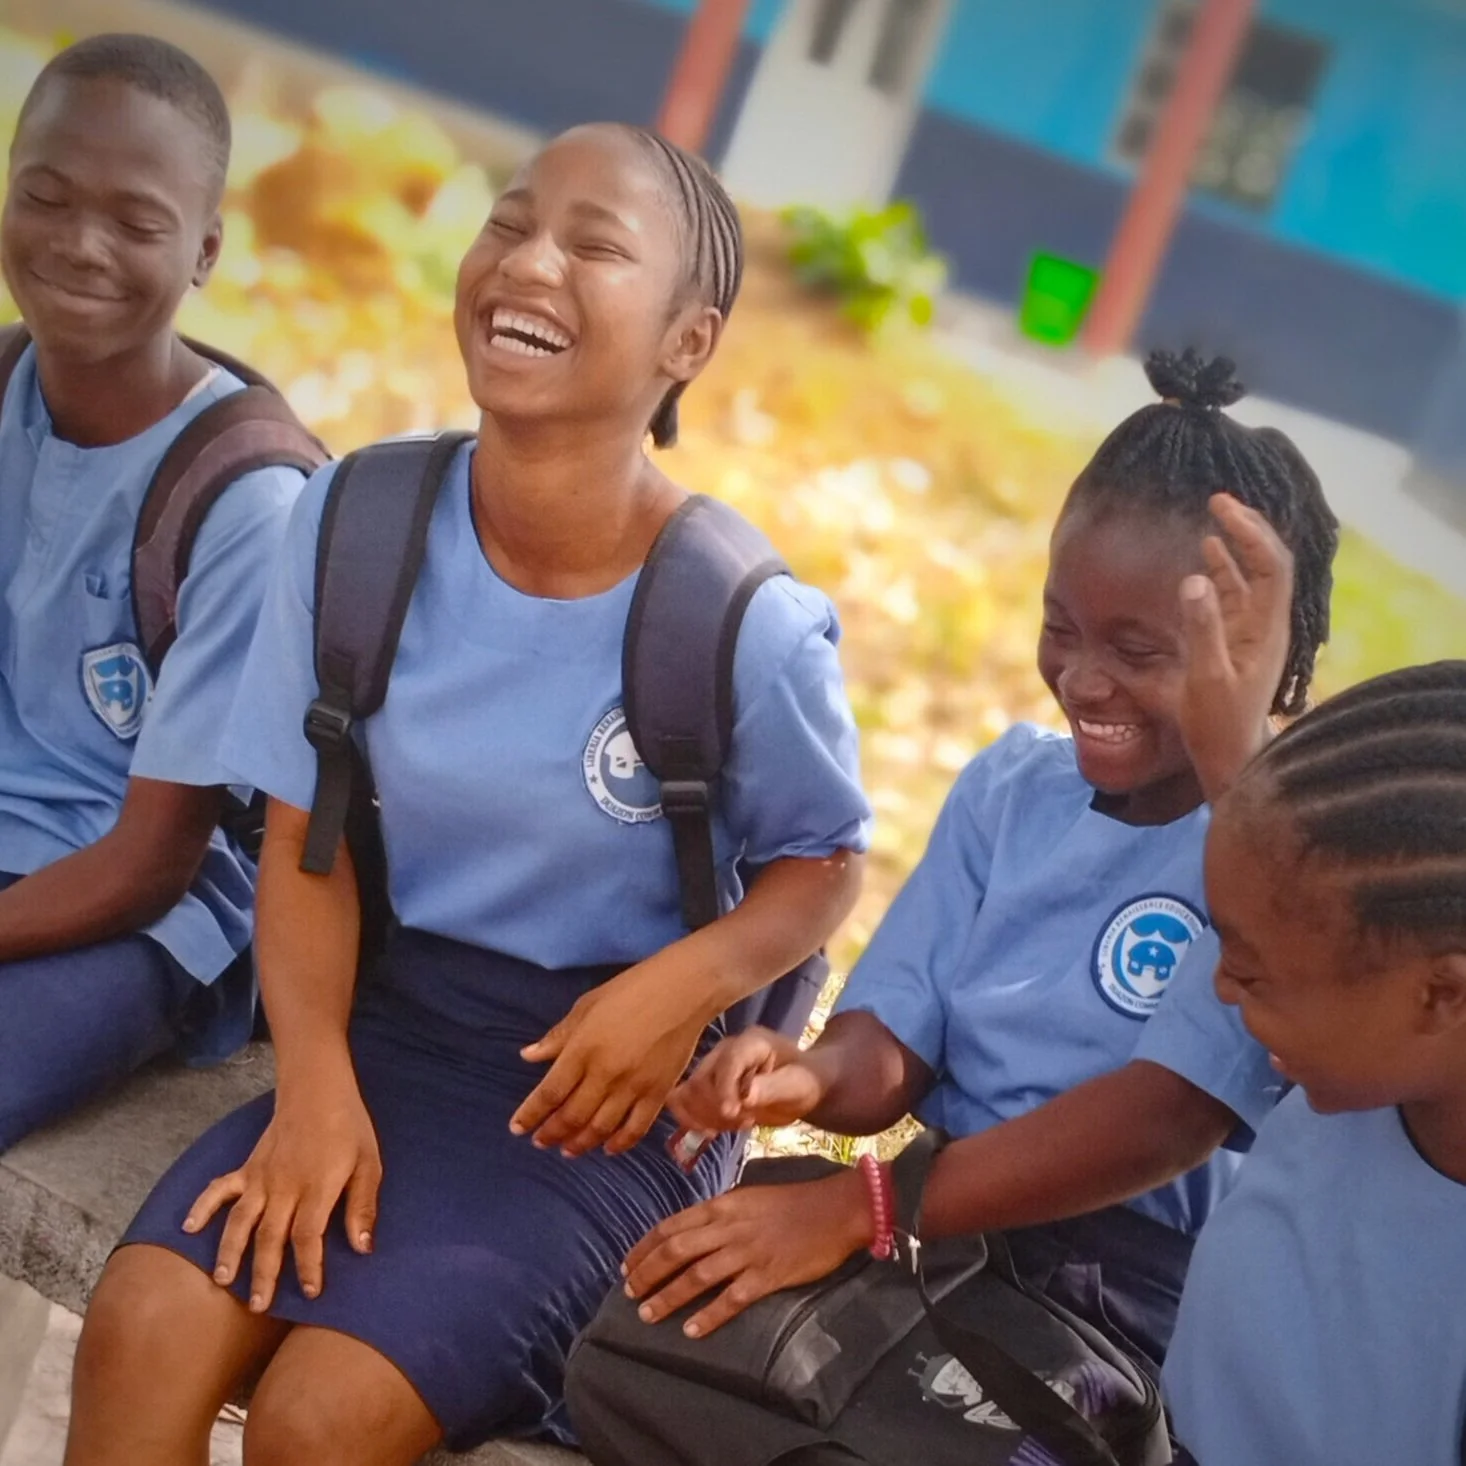
ANNUAL UPDATE 2020-21

ANNUAL UPDATE 2019-20
LREC WASSCE RESULTS 2026
#1 school in Margibi County
RANKED IN top 50 schools IN LIBERIA
HIGHLIGHTS
96% of LREC students passed in all 9 subjects
100% of LREC students passed in 8+ subjects
100% of LREC students earned A1-C6 (credit) in 5+ subjects inc. Math & English (vs. 4% nationally)
43.5% of LREC students earned A1-C6 (credit) in 7+ subjects inc. Math & English (vs. <1% nationally)
100% of LREC students earned A1-B3 in 3+ subjects
71% of LREC students earned A1-B3 in 4+ subjects
GRADES BY TYPE (%)
ENROLMENT
HISTORICAL DATA
| ACADEMIC YEAR ENDING | 2017 | 2018 | 2019 | 2020 | 2021 | 2022 | 2023 | 2024 | 2025 | 2026 |
| Students | 341 | 348 | 321 | 361 | 350 | 382 | 392 | 361 | 384 | 348 |
| % female | 50% | 51% | 56% | 55% | 55% | 51% | 54% | 51% | 49% | 47% |
| Alumni | 17 | 34 | 56 | 68 | 86 | 108 | 133 | 153 | 178 | 202 |
| % female | 71% | 53% | 52% | 51% | 55% | 51% | 53% | 55% | 56% | 55% |
| Staff | 37 | 41 | 43 | 45 | 46 | 41 | 42 | 38 | 37 | 38 |
| % female | 32% | 29% | 28% | 38% | 39% | 39% | 40% | 47% | 49% | 47% |
| Average class size | 24 | 25 | 23 | 26 | 23 | 26 | 26 | 24 | 26 | 23 |
| Students per teacher | 17 | 14 | 12 | 13 | 13 | 15 | 16 | 15 | 17 | 15 |
| Students on full scholarship | 1 | 1 | 4 | 5 | 7 | 21 | 20 | 21 | 12 | 9 |
| Students on partial scholarship | 0 | 14 | 20 | 17 | 14 | 3 | 6 | 5 | 1 | 4 |
| Years of operation | 10 | 11 | 12 | 13 | 14 | 15 | 16 | 17 | 18 | 19 |
| WEST AFRICA EXAMINATION RESULTS | 2017 | 2018 | 2019 | 2020 | 2021 | 2022 | 2023 | 2024 | 2025 | 2026 |
| WASSCE: Students passing any 5+ subjects | N/A | 0% | 14% | 83% | 33% | 96% | 80% | 100% | 100% | 100% |
| Percentage points higher than National | N/A | +67 | +11 | +43 | + 45 | |||||
| WASSCE: Students passing any 6+ subjects | N/A | 0% | 9% | 58% | 0% | 42% | 12% | 95% | 92% | 100% |
| WASSCE: Students passing any 7+ subjects | N/A | 0% | 5% | 8% | 0% | 13% | 0% | 19% | 38% | 100% |
| WASSCE: Students passing any 8+ subjects | N/A | 0% | 0% | 0% | 0% | 0% | 0% | 0% | 8% | 100% |
| WASSCE: Students passing all 9 subjects | N/A | 0% | 0% | 0% | 0% | 0% | 0% | 5% | 0% | 96% |
| WASSCE: A1-B3 (Good/Distinction) grades | N/A | 0% | 0% | 0% | 1% | 4% | 7% | 0% | 2% | 41% |
| WASSCE: C4-6 (Credit) grades | N/A | 0% | 3% | 14% | 21% | 36% | 21% | 16% | 20% | 29% |
| WASSCE: D7-E8 (Pass) grades | N/A | 11% | 42% | 63% | 40% | 39% | 43% | 52% | 49% | 29% |
| WASSCE: F9 (Fail) grades | N/A | 89% | 55% | 23% | 39% | 21% | 21% | 32% | 29% | 0% |
| LJHSCE: Students passing all subjects | N/A | 100% | 100% | 100% | 100% | 96% | N/A | 92% | 84% | |
| ALUMNI PATHWAYS (60% KNOWN) | 2017 | 2018 | 2019 | 2020 | 2021 | 2022 | 2023 | 2024 | 2025 | 2026 |
| Students in cohort | 17 | 17 | 22 | 12 | 18 | 22 | 25 | 20 | 25 | 24 |
| Enrolled in university | 94% | 88% | 68% | 67% | 44% | 45% | 28% | 30% | 0% | 0% |
| Enrolled in vocational or technical training | 18% | 6% | 27% | 17% | 11% | 5% | 0% | 5% | 0% | 0% |
| Attained a bachelor's (4 year) degree | 29% | 35% | 9% | 25% | 6% | 5% | 0% | 0% | 0% | 0% |
| Attained an associate (2 year) degree | 18% | 12% | 5% | 0% | 0% | 5% | 0% | 0% | 0% | 0% |
| Attained a trade certificate or diploma | 6% | 6% | 23% | 17% | 6% | 5% | 0% | 0% | 0% | 0% |